December 14, 2025

How Redlining Designed Modern Cities

How Redlining Designed Modern Cities

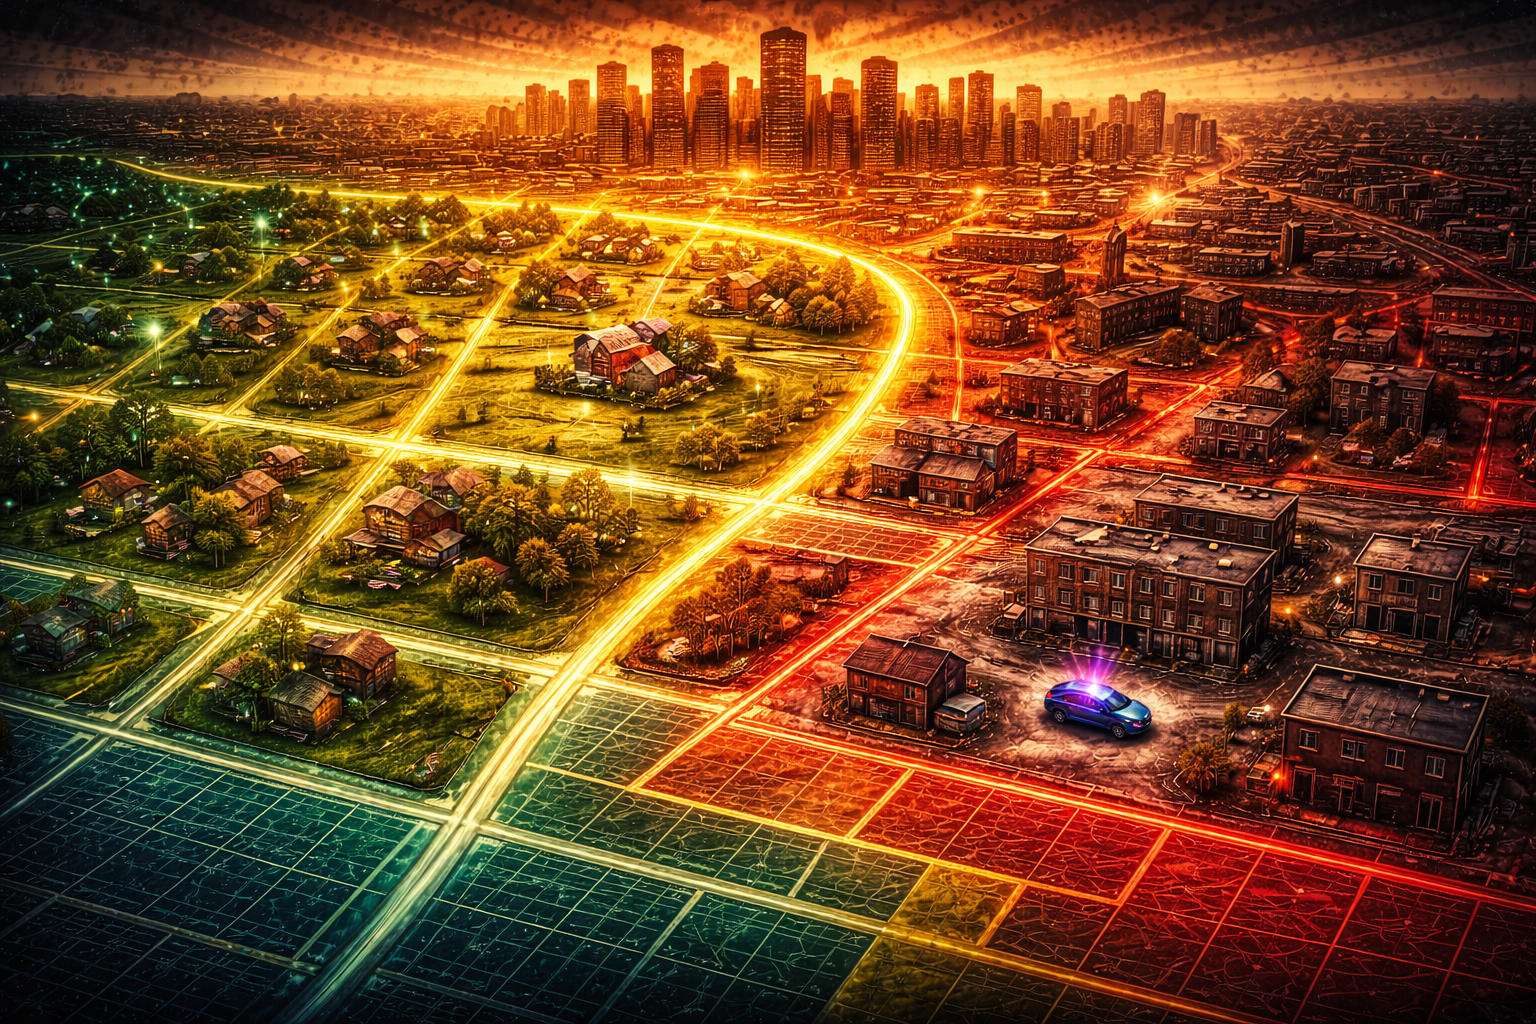
Many people think of redlining as a discriminatory housing practice from the past. But redlining didn’t just affect who could buy a home—it shaped where highways were built, where schools were funded, where hospitals were located, and how wealth accumulated.

Redlining didn’t simply exclude people.
It designed modern cities.

Understanding redlining helps explain why inequality looks so spatial today—why some neighborhoods are well-resourced and others struggle, even generations later.

What Was Redlining?

In the 1930s, federal agencies created maps to assess mortgage lending risk in cities across the U.S.

Neighborhoods were graded:

  • Green (“Best”)
  • Blue (“Still Desirable”)
  • Yellow (“Declining”)
  • Red (“Hazardous”)

Race played a central role. Neighborhoods with Black residents—regardless of income—were often marked red.

These maps guided:

  • mortgage lending
  • insurance decisions
  • public and private investment

Once a neighborhood was redlined, access to credit largely disappeared.

Redlining Was Policy, Not Opinion

Redlining wasn’t informal prejudice. It was institutional.

Federal housing agencies:

  • denied mortgage insurance in redlined areas
  • encouraged lenders to avoid “hazardous” neighborhoods
  • subsidized suburban development elsewhere

At the same time, White homebuyers received low-interest, government-backed loans—often unavailable to Black families.

The result: two housing markets, legally and financially separated.

How Redlining Shaped the Built Environment

Redlining influenced more than mortgages.

Redlined neighborhoods were more likely to:

  • receive fewer infrastructure investments
  • be targeted for highways and industrial zoning
  • have older housing stock
  • lack green space and tree cover
  • host polluting facilities

Meanwhile, non-redlined areas accumulated:

  • newer housing
  • better schools (funded by property taxes)
  • stronger political influence
  • rising property values

The map became the blueprint.

Wealth Followed the Lines

Homeownership became the primary way American families built wealth.

In redlined areas:

  • renters replaced owners
  • home values stagnated
  • equity couldn’t accumulate
  • inheritance opportunities vanished

In green- and blue-rated areas:

  • homes appreciated
  • equity financed education and businesses
  • wealth transferred across generations

The racial wealth gap widened—by design.

Health, Education, and Opportunity

The effects extended far beyond housing.

Redlined neighborhoods today are more likely to experience:

  • higher rates of asthma and chronic illness
  • lower life expectancy
  • underfunded schools
  • limited access to grocery stores and healthcare
  • higher heat exposure due to lack of tree cover

These patterns are not accidental. They follow historical investment lines.

Urban Renewal and Reinforced Design

Mid-century “urban renewal” projects often doubled down on redlining.

Highways cut through redlined neighborhoods.
Communities were displaced.
Investment flowed elsewhere.

Redlining made displacement easier by depressing land values first.

Why Ending Redlining Didn’t End Its Effects

Redlining was outlawed in the late 1960s—but its design remained.

  • property values carried forward
  • school funding stayed tied to housing
  • infrastructure gaps persisted
  • credit access lagged
  • segregation hardened through zoning and pricing

Stopping a policy doesn’t undo decades of accumulated advantage and disadvantage.

Redlining Is Still Visible

Researchers have repeatedly shown that:

  • historic redlined areas correlate with modern poverty patterns
  • environmental risk aligns with redlining maps
  • policing intensity often mirrors old boundaries
  • investment disparities persist block by block

Cities today still operate on a blueprint drawn generations ago.

Why This History Matters

Redlining explains why inequality looks geographic.

It helps answer questions like:

  • Why do some neighborhoods lack basic services?
  • Why do schools vary so dramatically by zip code?
  • Why does wealth cluster so predictably?

Redlining didn’t just limit opportunity.
It designed where opportunity could exist.

Questions to Reflect On

  • How does your city reflect historical investment lines?
  • What neighborhoods received infrastructure—and which didn’t?
  • What would repair look like if design was intentional?

Dig Deeper Sources

Mapping Inequality (University of Richmond)
https://dsl.richmond.edu/panorama/redlining/

National Archives — Housing & Redlining
https://www.archives.gov/

Brookings Institution — Redlining & Urban Inequality
https://www.brookings.edu/

CDC — Social Determinants of Health
https://www.cdc.gov/

What to Read Next

How the Homestead Act Built Wealth for Others While Excluding Black Families
An explanation of how the Homestead Act helped build wealth for millions while Black families were largely excluded—shaping land ownership and inequality across generations.
The Cycle: Black Progress → Backlash → Restrictive Laws
A look at how Black progress has repeatedly been followed by backlash and restrictive laws—and why the cycle continues across generations.